
How Quants Keep a Trading Loop From Overfitting (Full Framework)

The loop handed you a strategy with twelve rules and a flawless equity curve. Strip it down, and you usually find two rules doing the work and ten fitting the past. Those ten are the reasons it falls apart the week you go live.
Let's get straight to it….
Bookmark this. Turn a plain-English idea into a backtest in minutes, then deploy it live to your exchange. See what actually holds up before you risk a dollar. Closed beta, limited spots. Join at horizon.trade or DM @horizon_trade_x
Here is the roadmap:
Why a loop adds overfitting you never asked for
A loop chasing a higher score keeps bolting on rules, filters, and thresholds, because each one nudges the backtest up a little. Most of that lift is the loop fitting the exact past it was shown. What comes out the other end is a couple of real edges buried under a layer of decoration that only works in-sample. Keeping a loop honest is mostly the work of finding that decoration and cutting it, and there are concrete tests for doing exactly that.
Ablation: kill one rule at a time
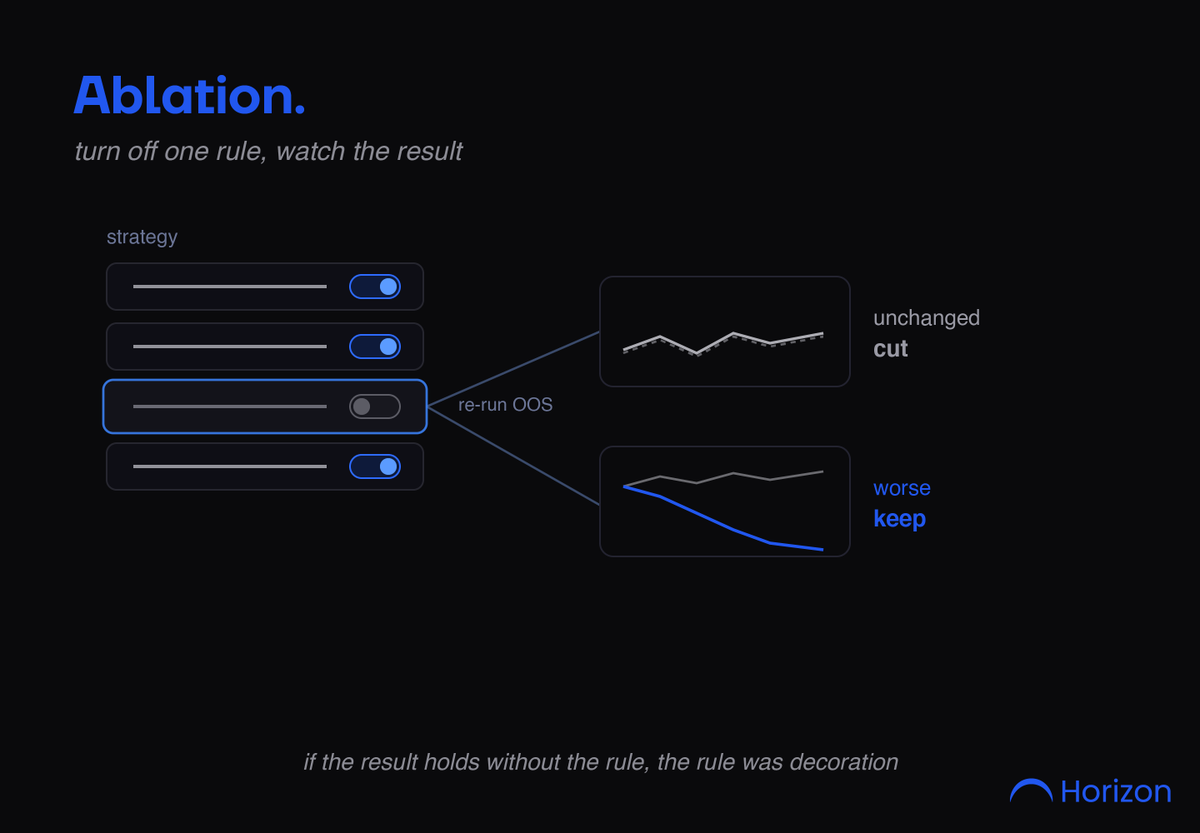
The most direct test is borrowed from machine learning. Switch off a single rule, re-run out of sample, and watch the result. If it barely moves, that rule was carrying no real weight, and it is a decoration you can delete. If it drops, the rule is doing something worth keeping. Run this for every component, and you get a ranked list of what actually matters. A strategy with twelve rules where only two survive ablation is a two-rule strategy wearing a costume.
The parameter plateau test
Real edges are not fragile. Take any threshold the loop tuned, a lookback of 20 days or a stop at 2 percent, and move it ten to twenty percent each way. A genuine edge degrades gently, so the settings around it all still work and form a plateau. An overfit one sits on a sharp spike that works at exactly 20 and collapses at 18 or 22. A spike means the loop memorized a number rather than found a pattern, while a broad plateau is the signature of something real

The clean way to see this is to score the strategy across a grid of values and look at the shape of the result. If a lookback of 20 is the winner, then 18, 19, 21, and 22 should all land in roughly the same range. A broad, raised plateau where the neighbors hold means the edge does not depend on one exact number, which is what a real market inefficiency looks like. An isolated peak with mediocre results on either side is the warning sign, a setting that worked once in this history and nowhere around it.
The test gets stricter with every parameter, because they all have to hold at once. A strategy can look stable when you move the lookback alone and the stop alone, yet still sit on a joint spike where only that exact pair works. The more knobs the loop added, the more places a fragile combination can hide, which is one more reason to keep the parameter count low.
Robert Pardo built a walk-forward analysis around this in 1992, re-optimizing on rolling windows and checking that the chosen settings keep working on data they were never fit to. It also hands you a number, the share of in-sample performance that survives out of sample, and a strategy that keeps most of its edge across those windows is far more likely to keep it once live. Walk-forward only tests a single price path, so pair it with the ablation and complexity checks rather than leaning on it alone.
The complexity penalty
Every extra rule is another knob the loop can turn to fit noise, so the bar a strategy clears should rise with the number of parameters it carries. Quant desks treat simplicity as a feature in itself. Between two strategies with similar out-of-sample results, the leaner one is more likely to keep working, because it had fewer ways to fool you in the first place. If a rule cannot justify the degree of freedom it costs, it goes. Counting parameters honestly is half the discipline, since each one you add quietly raises the odds that the backtest is fitting history rather than finding an edge

Where Horizon runs this
Testing a leaner version against a bloated one is the kind of comparison Horizon is built for. You can express the same idea with and without a given rule and put the variants side by side

Each is scored out of sample, so a rule that only helped in-sample shows up as a variant that looks worse once the gate is applied

You keep the version that survives with the fewest moving parts, which is usually the leanest strategy that still holds up on data it has not seen.
How traders get this wrong
The mistakes repeat. They judge a rule by its in-sample contribution, which rewards the overfit ones most. They never ablate, so they cannot tell a load-bearing rule from a decorative one. They tune a parameter to its single best value and ship the spike. And they read more rules as more sophistication, when each one is another way to fit the past.
Thanks for reading. A loop will always hand you more than you need. The work is figuring out which two or three rules are the edge and deleting the rest, before the market deletes them for you.
Before you go. Horizon turns a plain-English idea into a backtest, strips it to what holds up, and deploys it live to your exchange. Closed beta, limited spots. Join at horizon.trade or DM @horizon_trade_x